
- About 56,000 home purchases were canceled, equal to 15% of homes that went under contract—the highest percentage of any June on record. Buyers are skittish due to elevated mortgage rates and record-high home prices.
- 20% of homes for sale last month had a price cut—the highest June share on record. Many sellers are dropping prices because their homes are sitting on the market, causing listings to pile up; active listings posted the biggest annual gain on record.
- Home sales fell roughly 1% from a month earlier in June—the biggest drop since October.
Deals to purchase homes are falling through at a record rate as high housing costs give buyers cold feet.
Nearly 56,000 home-purchase agreements were canceled in June, equal to 14.9% of homes that went under contract that month—the highest percentage of any June on record.
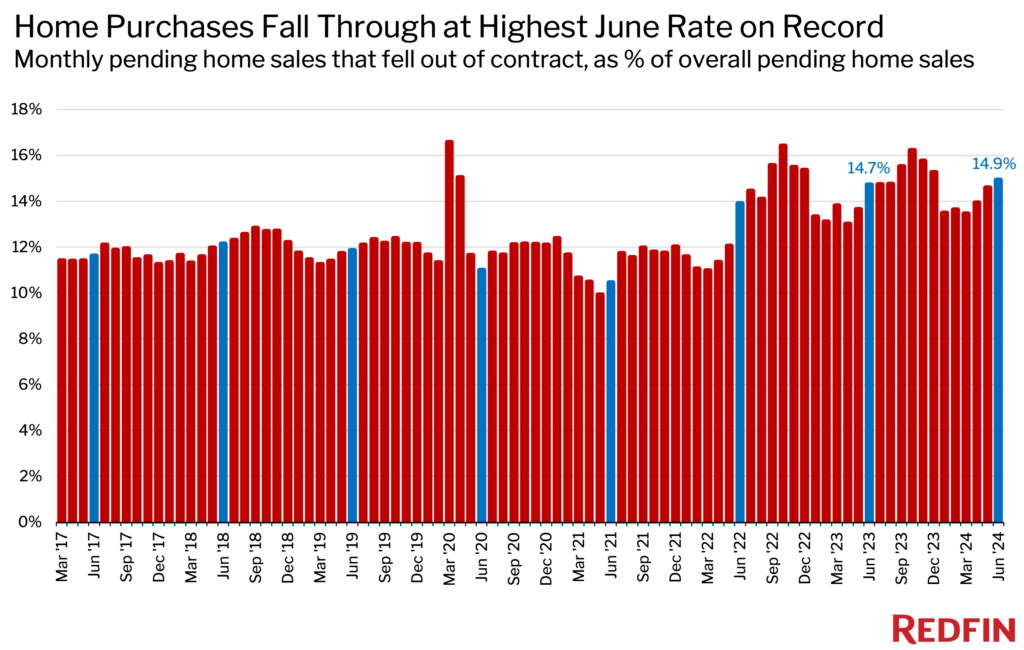
Note: Homes that fell out of contract during a given month didn’t necessarily go under contract the same month; for example, a home that fell out of contract in June could have gone under contract in May. Records for purchase cancellations go back through 2017, while records for most other statistics in this report go back through 2012.
House hunters are having trouble committing because buying a home is more expensive than ever. The median home sale price rose 4% year over year to a record $442,525 in June, and the average interest rate on a 30-year mortgage was 6.92%. While that’s down slightly from 7.06% the prior month, it’s still more than double the all-time low hit during the pandemic.

“Buyers are getting more and more selective,” said Julie Zubiate, a Redfin Premier real estate agent in the San Francisco Bay Area. “They’re backing out due to minor issues because the monthly costs associated with buying a home today are just too high to rationalize not getting everything on their must-have list.”
June 2024 Housing Market Highlights: United States
| June 2024 | Month-over-month change | Year-over-year change | |
|---|---|---|---|
| Median sale price | $442,525 | 0.9% | 4.0% |
| Homes sold, seasonally adjusted | 417,179 | -0.5% | -1.1% |
| Total homes for sale, seasonally adjusted (active listings) | 1,636,110 | -0.1% | 12.8% |
| Months of supply | 2.6 | 0.2 | 0.7 |
| Median days on market | 32 | 1 | 3 |
| Share of for-sale homes with a price drop | 19.8% | 1.7 ppts | 5.4 ppts |
| Share of homes sold above final list price | 35.1% | 0.0 ppts | -4.5 ppts |
| Average sale-to-final-list-price ratio | 99.9% | 0.1 ppts | -0.4 ppts |
| Pending sales that fell out of contract, as % of overall pending sales | 14.9% | 0.3 ppts | 0.2 ppts |
| 6.92% | -0.14 ppts |
0.21 ppts |
Note: Data is subject to revision
Three Florida Metros Led the Nation in Home-Purchase Cancellations
In Orlando, about 900 home-purchase agreements were canceled in June, equal to 20.8% of homes that went under contract that month—the highest percentage among the 50 most populous U.S. metropolitan areas. Next came Jacksonville (20.5%), Tampa (20.5%), Las Vegas (20.2%) and San Antonio (19.9%).
“We’re seeing nightmare scenarios where deals are getting canceled at the last minute for the most minute reasons,” said Rafael Corrales, a Redfin Premier agent in Miami, where roughly 2,500 home purchases were canceled in June—equal to 17.6% of homes that went under contract. “Buyers often back out during the inspection period because they find something they don’t like, but affordability is really the underlying issue. I don’t want my buyers to be surprised by all of the expenses that come with owning a home in Florida, so I advise them to proactively research the hefty costs of insurance, property taxes and HOA fees, in addition to the cost of their mortgage payment.”
Corrales also advises customers, now more than ever, to seek legal representation. Buyers and sellers in Florida are having to sign all sorts of additional addendums, Corrales said, and many condos owners are getting hit with hefty special assessments. That’s because the 2021 Surfside condo collapse led to a Florida law that requires condo buildings to build up reserve funds and get new structural inspections if they’re over 30 years old. Condo buyers are entitled to see a building’s HOA board meeting minutes before finalizing a purchase, but Corrales said some are having to hire lawyers because sellers aren’t willingly sharing the information.
Nearly 1 in 5 Sellers Dropped Their Asking Price as Homes Sat on the Market—the Highest June Rate on Record
Roughly one in five (19.8%) homes for sale in June had a price cut—the highest level of any June on record. That’s up from 14.4% a year earlier and is just shy of the 21.7% record high set in October 2022.

Some sellers are reducing their prices because their homes are sitting on the market and getting stale—the result of an ongoing affordability crisis impacting buyers. The typical home that sold in June spent 32 days on the market, the longest of any June since 2020. That’s up three days from a year earlier—the biggest annual increase since last summer. Listings are piling up as a result; active listings, or the total number of homes for sale, were little changed from a month earlier but jumped 12.8% from a year earlier—the largest annual gain on record.
U.S. Home Sales Posted the Biggest Monthly Decline Since October
Home sales fell 0.5% month over month in June on a seasonally adjusted basis. While that may seem like a small decline, it’s the biggest since October 2023. Home sales dropped 1.1% from a year earlier, and were 21.5% below pre-pandemic (June 2019) levels.
Sales are sluggish because many Americans can’t afford to buy homes, and because while mortgage rates ticked down in June (and have fallen further this month), some buyers are waiting on the sidelines in hopes that they’ll drop even more. But those buyers may be waiting in vain, said Redfin Economics Research Lead Chen Zhao, as rates are unlikely to fall much in the next few months and markets have already priced in a September rate cut.
Metro-Level Highlights: June 2024
The bullets below are based on a list of the 50 most populous U.S. metropolitan areas. A full metro-level data table can be found in the “download” tab of the dashboard in the monthly section of the Redfin Data Center. Refer to our metrics definition page for explanations of metrics used in this report. Metro-level data is not seasonally adjusted. All changes below represent year-over-year changes.
- Prices: Median sale prices rose most from a year earlier in Anaheim, CA (13.2%) Newark, NJ (12.6%) and Nassau County, NY (12%). They fell in four metros, all of which are in Texas: Austin (-5.5%), Dallas (-1.6%), San Antonio (-1.3%) and Fort Worth (-0.2%).
- Price cuts: In Indianapolis, 49.2% of listings had a price drop—a higher share than any other metro Redfin analyzed. Next came Denver (46.6%) and Tampa (43%). The lowest shares were in Newark (15.2%), Chicago (16.3%) and Milwaukee (17%).
- Active listings: Active listings rose most in Tampa (47%), Fort Lauderdale, FL (45.3%) and Orlando (41.4%). They fell most in Chicago (-7.4%), New Brunswick, NJ (-7%), Chicago (-7.3%) and New York (-5.8%).
- Closed home sales: Home sales rose in just one metro: San Jose, CA (1.8%). They fell least in Portland, OR (-3.2%), Oakland, CA (-3.7%) and San Diego (-5%), and fell most in West Palm Beach, FL (-23.5%), Fort Lauderdale (-23%) and Virginia Beach, VA (-17.7%).
- Sold above list price: In San Jose, 72.1% of homes sold above their final list price, the highest share among the metros Redfin analyzed. Next came Newark (71.7%) and Oakland (63.1%). The shares were lowest in West Palm Beach (7.3%), Miami (11.4%) and Fort Lauderdale (12.3%).


